- Home
- About
- Services
Data Engineering
and Analytics - Resources
- Partner with Us
Petrochemical Demand Forecast
Petrochemical Demand Forecast
Data Engineering Case Study
Client
A leading petrochemical market intelligence provider in Europe
The Business Need
A leading petrochemical market intelligence provider wanted to establish a system for real-time tracking of the movement and usage of Natural Gas fuel across 18 countries in Europe. The readings from various Gas Operators across these zones are published in the public domain. The project involved harvesting data in real-time, normalization of the readings across different systems of measurement, and time zones, and validation using business rules and against historic levels to ensure the correctness of data before pushing onto the Data Lake. The real-time Tableau dashboard is populated by this feed and this showcases the natural gas flow and outages across 18 countries on a visual model. The demand and storage data along with historical values obtained at the time of the initial setup of a tracking location help to bring about predictions based on historical trends. The project currently has 8 years of data backup integrated into the data lake to increase the accuracy of predictions based on historical trends.
Please share your details to learn more about our case studies.
Challenges
The major challenge was to have fully automated real-time data harvesting from hundreds of sites followed by data normalization, versioning, and lineage and aggregation reports on a large scale. Data imputation had to be implemented and outlier elimination had to be done to refine the quality of the final dataset. The final visualization represents the depth and breadth of Gas fundamentals data across different geographic zones, time trends, and predictions. trends.
Our Solution

- An end-to-end ETL solution was built using Microsoft SQL Server Integration Services with Python scrapebots for data harvesting purposes.
- Tableau-based interactive dashboards were used for showcasing the flow of gas and the variations in flow and trends based on past data.
- Ensure solution was implemented on cloud infra with Disaster Recovery Server that ensures 99.9% uptime and business continuity even during any disasters.
Highlights
1. Generating a variety of reports to help the customer’s business
2. Content delivered in various formats–XML, CSV
3. Data error has been eliminated by 90%
For a detailed presentation of specific use cases, please write back to us at support@techmobius.com
The Business Need
A leading petrochemical market intelligence provider wanted to establish a system for real-time tracking of
movement and usage of Natural Gas fuel across 18 countries in Europe. The readings from various Gas Operators across these zones are published on public domain. The project involved harvesting of data on real-time,
normalization of the readings across different systems of measurement, time zones and validation using business
rules and against historic levels to ensure the correctness of data before pushing onto the DataLake. The real-time
Tableau dashboard is populated by this feed and this showcases the natural gas flow and outages across 18
countries on a visual model. The demand and storage data alongwith historical values obtained at the time of
initial setup of a tracking location help to bring about predictions based on historic trends. The project currently
has 8 year data backup integrated onto the datalake to increase the accuracy of predictions based on historic
trends .
Challenges
The major challenge was to have fully automated real-time data harvesting from hundreds of sites followed by data normalization, versioning and lineage and aggregation reports on a large-scale. Data imputation had to be implemented and outlier elimination had to be done to refine the quality of the final dataset. The final visualization represents the depth and breadth of Gas fundamentals data across different geographic zones, time-trends and predictions.

The Mobius Approach

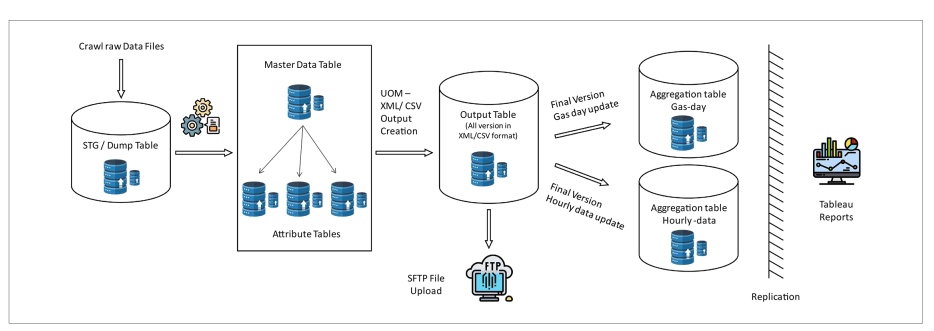
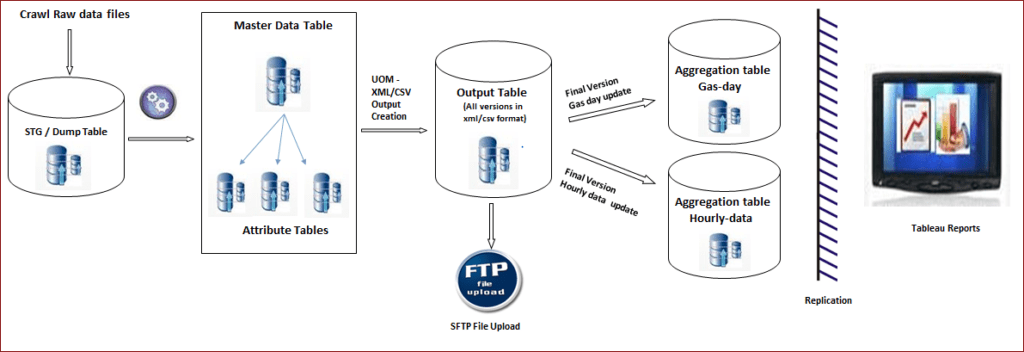
An end-to-end ETL solution was built using Microsoft SQL Server Integration Services with python scrape bots for data harvesting purposes. Customized data harvesting bots monitor & gather data from the target monitored sites whenever published.
From the bots, data is moved to a Azure BLOB and data pipelines aid in bringing in the data to relational tables and apply standardization rules for conversion. Normalization of timezones, units and establishing versions of data are done through ETL routines and normalization jobs.
Data lineage is established and brought to a structured format before feeding onto the Datalake for reporting.
Tableau-based interactive dashboards are used for showcasing the flow of gas and the variations in flow and trends based on past data.
The system helps the users to identify outages in a matter of seconds from the time of publishing on the site and this helps with the reporting and alerting of stakeholders in this regard.
Benefits
The solution we have provided is a highly scalable model. We can add any number of new web sources from different regions and the data can flow through the same workflow.
Generating variety of reports which will help the customer’s business. Some of the reports are:
- Cross Border reports
- Supply Demand
- European Storage
- European fundamentals
- LNG Flows
- Net flows
Entire solution is implemented on cloud infra with Disaster Recovery Server which will ensure 99.9% uptime and business continuity even during any disasters.
Content delivered in various formats – XML, CSV
Proper data archival ensures that the customer will have access to historical data

Related Case Studies
Price Monitoring Tool
Price Monitoring Tool Price monitoring tool DevOps Case Study Client A leading Australian…
Reporting Tool Solution
Reporting Tool Solution Reporting tool solution Data Consulting Case Study Client A Renowned…
Smart Product Classification
Smart Product Classification Smart Product Classification Website Development Case Study Client A leading…


